Benchmark Platform
Our benchmark is surfaced through DefiLantern — a partner-facing analytics platform that provides real-time rankings, historical performance data, and deep per-solver statistics.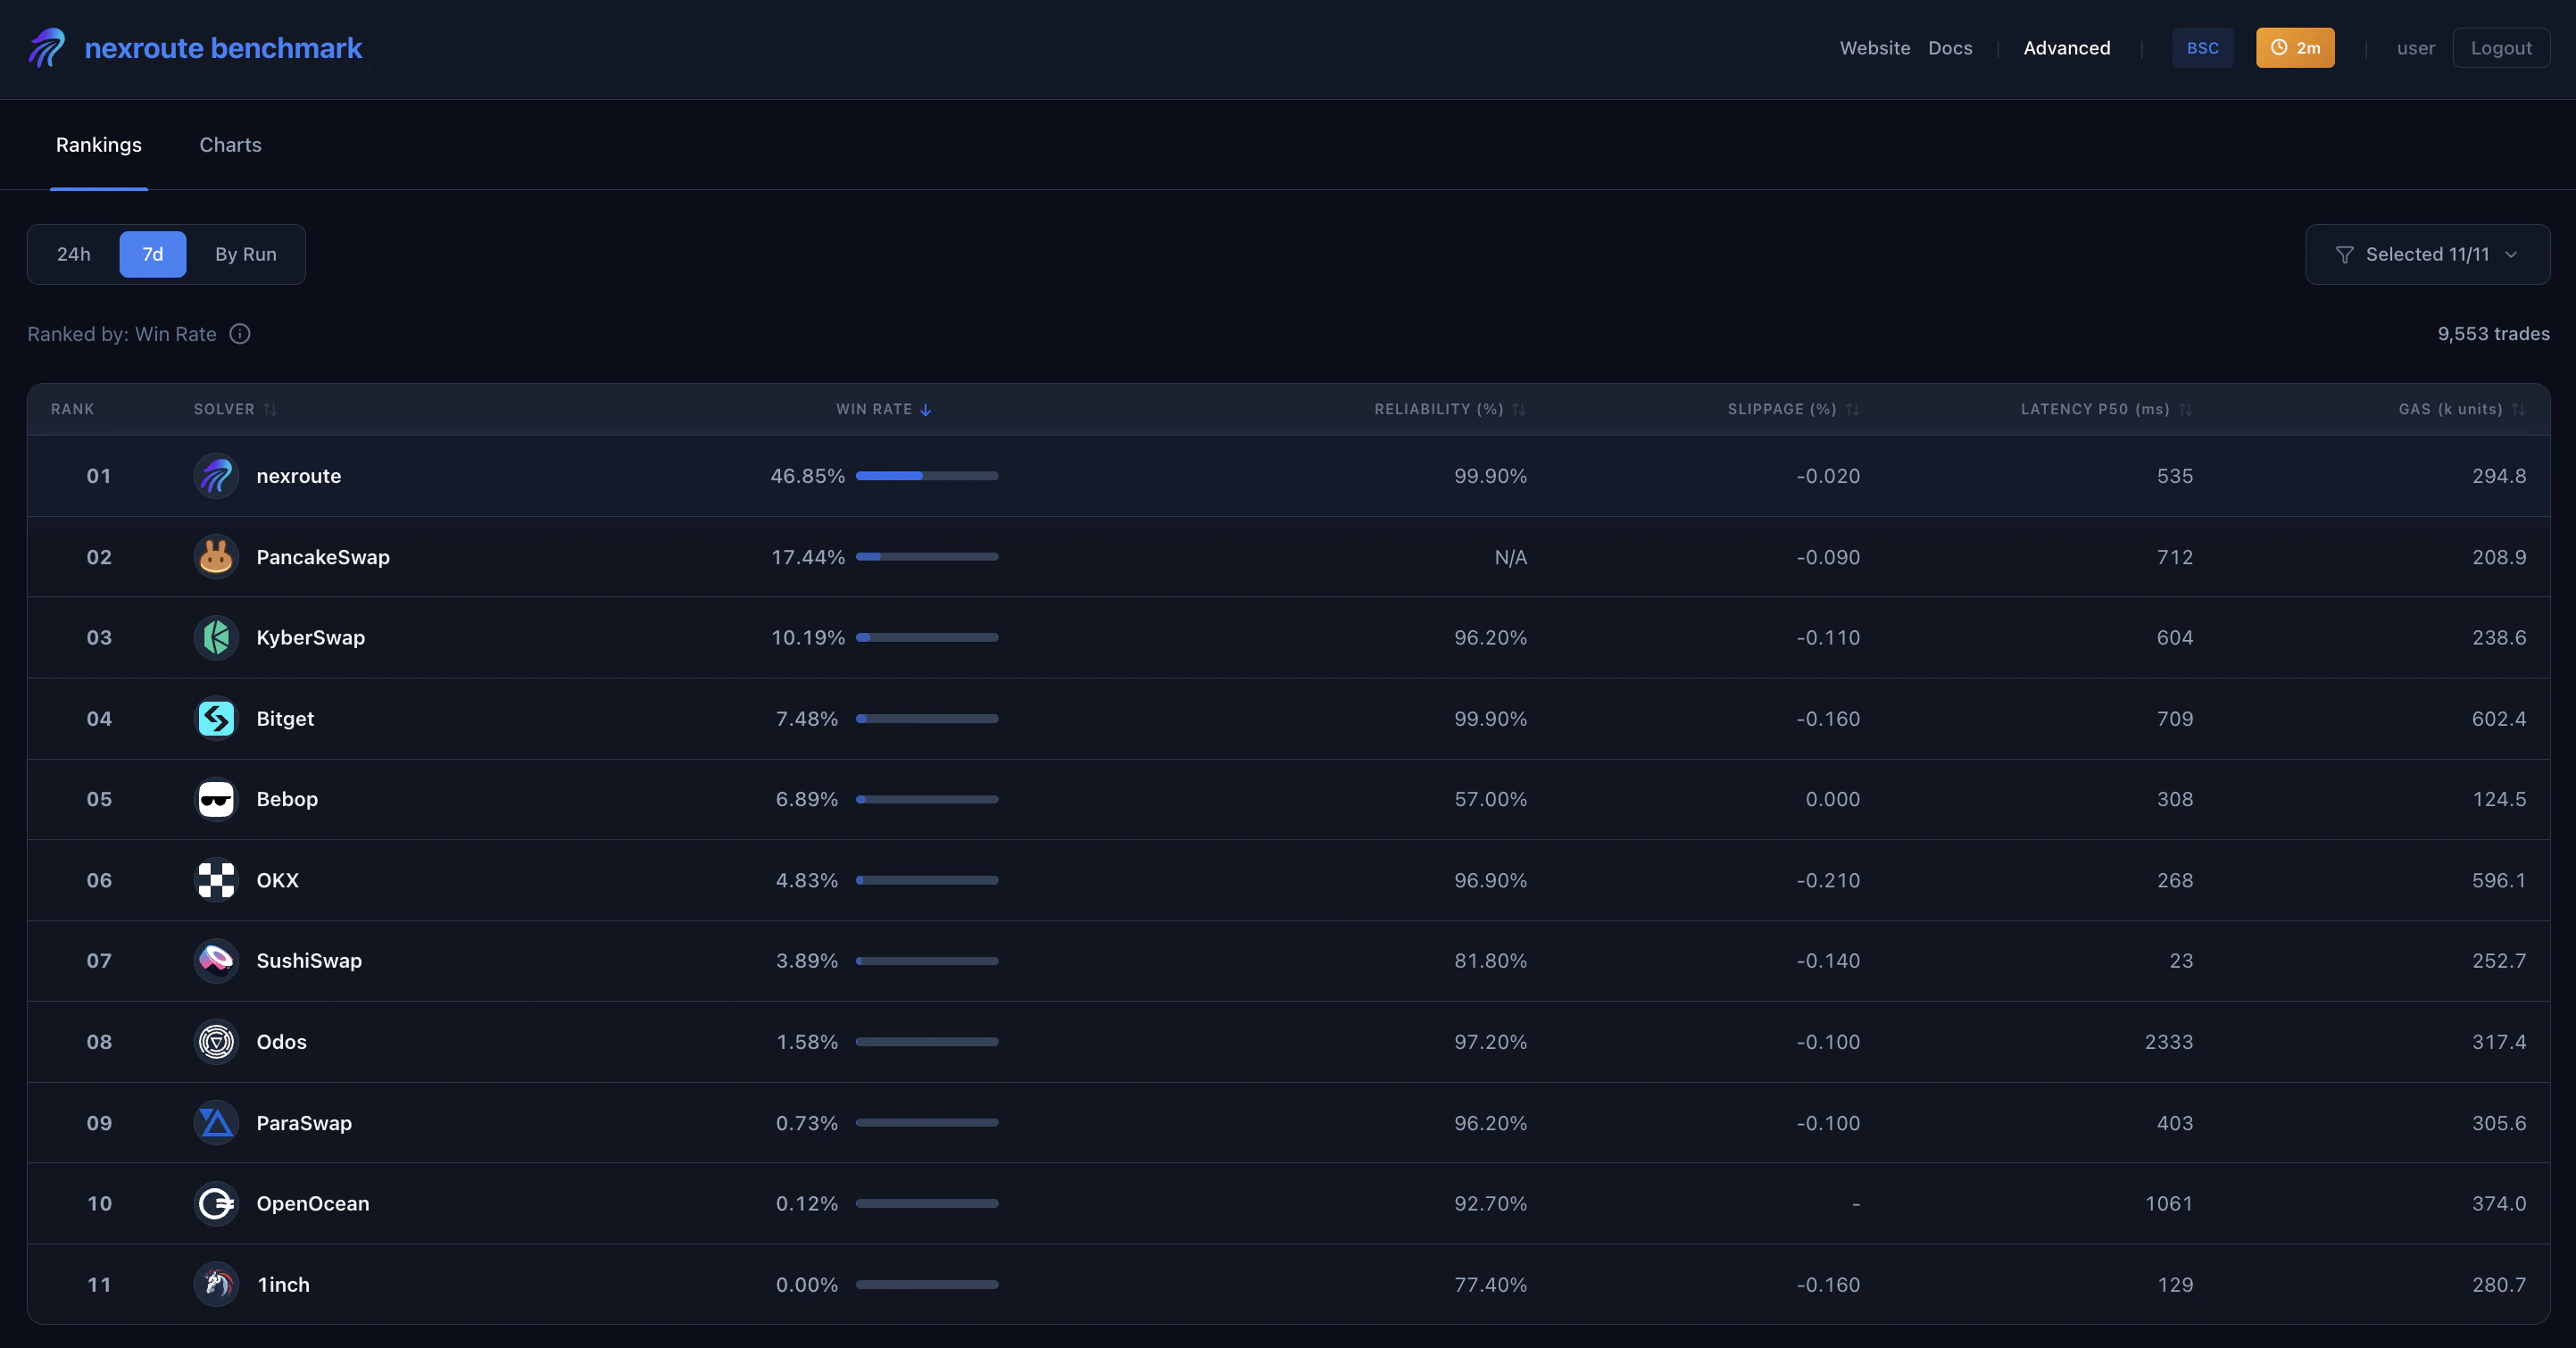
- DEX Aggregator Rankings — live win rate, reliability, slippage, latency, and gas rankings across all tested solvers
- Time windows — 24h and 7d rolling performance views
- Solver filter — drill down into specific aggregators
- Deep stats panel — per-solver breakdown including consistency score, win margins, amount-range performance, and delay simulation (t+10s)
To request partner access to DefiLantern, contact your nexroute business development representative or request API access.
Aggregators Tested
Key Metrics
Win Rate (Primary Metric)
The percentage of trades where a solver returned the highest net output — token value received minus gas cost. A solver “wins” a trade when its net USD output beats all other tested solvers on the same trade at the same block. This is the primary ranking metric.Reliability
Percentage of quote requests that returned a valid, executable response (as opposed to errors, timeouts, or simulation failures).Slippage (Deviation)
Median deviation between the advertised output amount and the actual simulated output. Positive means better than quoted; negative means worse.Quote Latency
API response time in milliseconds (p50). Measured from request dispatch to first valid response.Gas
Median estimated gas consumed during simulation (in thousands of units). Lower is better — gas cost is deducted when computing Net USD.Win @10s / Survival @10s / Drift @10s
Re-simulation of each quote 10 seconds after it was issued, against the live chain state at t+10s. Measures:- Win @10s — whether the quote would still win 10 seconds later
- Survival @10s — whether the quoted transaction would still execute without reverting
- Drift @10s — average value change between the original quote and t+10s re-execution
Methodology
Testing Infrastructure
The benchmark runs on a dedicated BSC geth node with specialized state-cloning capabilities. Every 30 minutes, a new benchmark run executes across all active solvers.Benchmark Process
Two run profiles alternate throughout the day:- Major tokens — Core pairs (WBNB, USDT, ETH, BTCB) with amounts ranging from ~100,000
- TrustWallet top tokens — The most traded tokens on TrustWallet over the past 30 days, covering a wider range of pairs including smaller-cap tokens, with amounts at ~100, and ~$1,000 equivalents
- Simultaneous quote requests — The benchmark node fires quote requests to all solver APIs concurrently. Each request specifies zero custom fees (where applicable), maximum slippage tolerance, and identical trade parameters.
- State cloning — As soon as all requests are dispatched, the node clones the current blockchain state. This becomes the reference state for all simulations.
- Fair execution simulation — Each solver’s returned calldata is executed against a fresh copy of the reference state, regardless of the solver’s API response time. This ensures all solvers are tested against identical market conditions and that no solver gains an advantage from slower latency.
- Data persistence — Trade details, metrics, transaction data, and simulation outcomes are stored and aggregated into the DefiLantern rankings.
Blockchain reorg handling: If the blockchain state becomes stale during simulation (e.g., due to a reorg), the trade is discarded for all solvers to maintain fairness.
Metrics Tracked Per Trade
Fairness Measures
- ✅ All solvers execute against identical blockchain state snapshots
- ✅ Concurrent API requests eliminate timing bias
- ✅ Zero custom fees and max slippage for best-case testing
- ✅ Transparent error tracking for API and simulation failures
- ✅ Trades discarded for all solvers during blockchain reorgs
Data Availability
DefiLantern provides partners with:- Live performance comparisons across all solvers
- 24h and 7d rolling aggregations
- Deep per-solver statistics (consistency, delay simulation, amount-range breakdowns)
- Downloadable result data (JSONL format) for independent verification
Running Your Own Tests
Running Tests
Step-by-step guide with code examples for reproducing benchmarks against your own node